The Bio-Based Energy Analysis Group (BEAG) is a trans-disciplinary research and outreach group housed in the University of Tennessee’s Institute of Agriculture. BEAG provides decision-makers in both government and industry with the latest economic, environmental, and policy analysis of the bio-based energy industry at local, state, regional, and national levels. The BEAG mission is to discover and disseminate knowledge that supports the bio-economy through the development of sustainable bio-based and renewable energy markets using holistic modeling approaches and quantitative analysis.
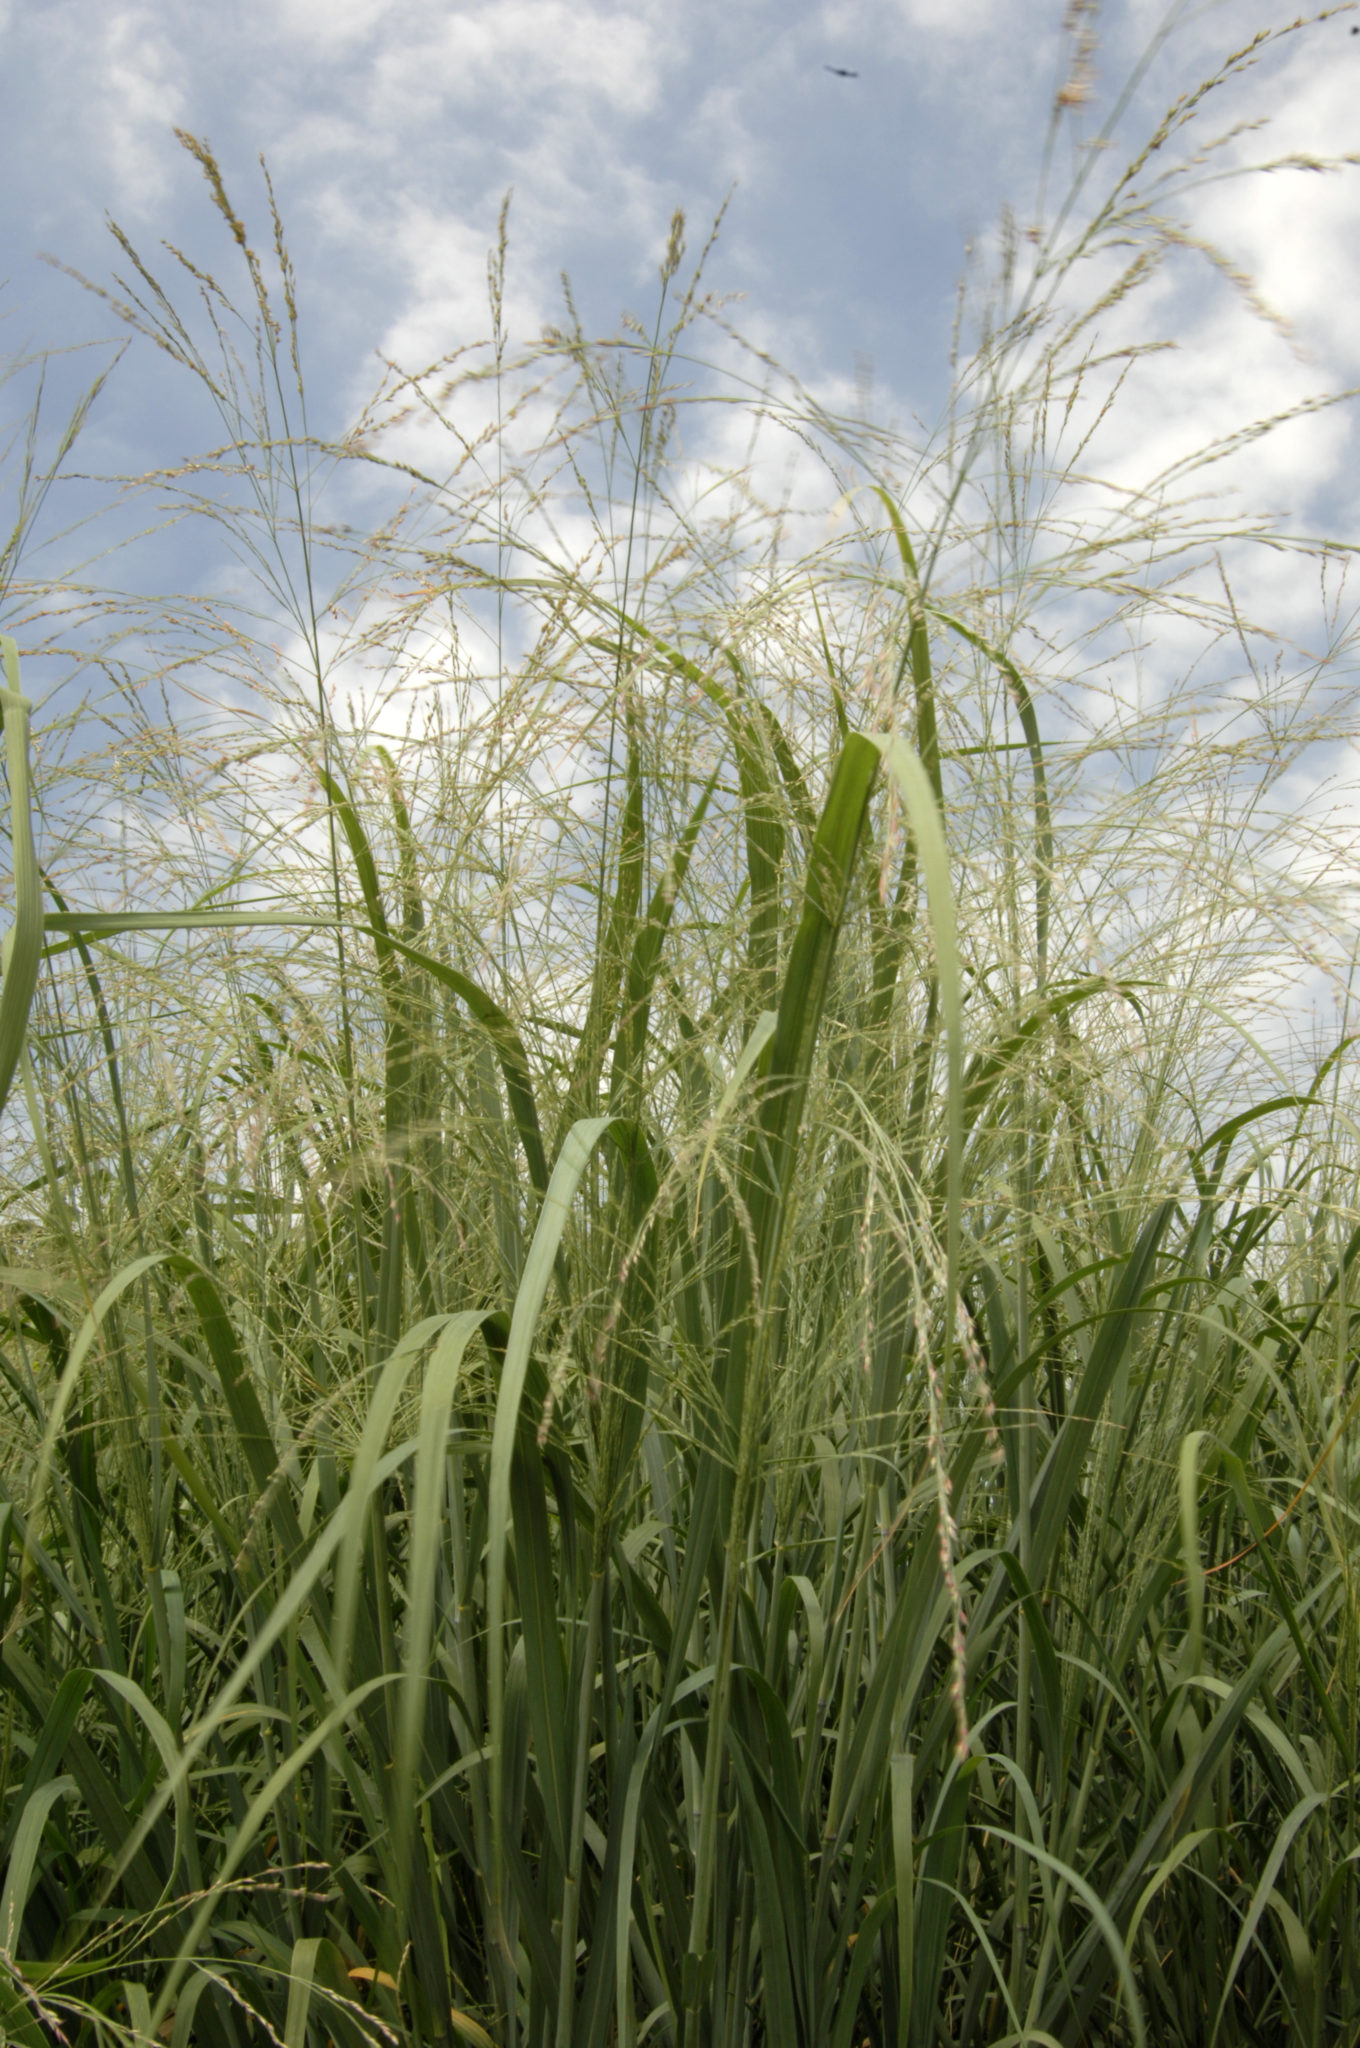
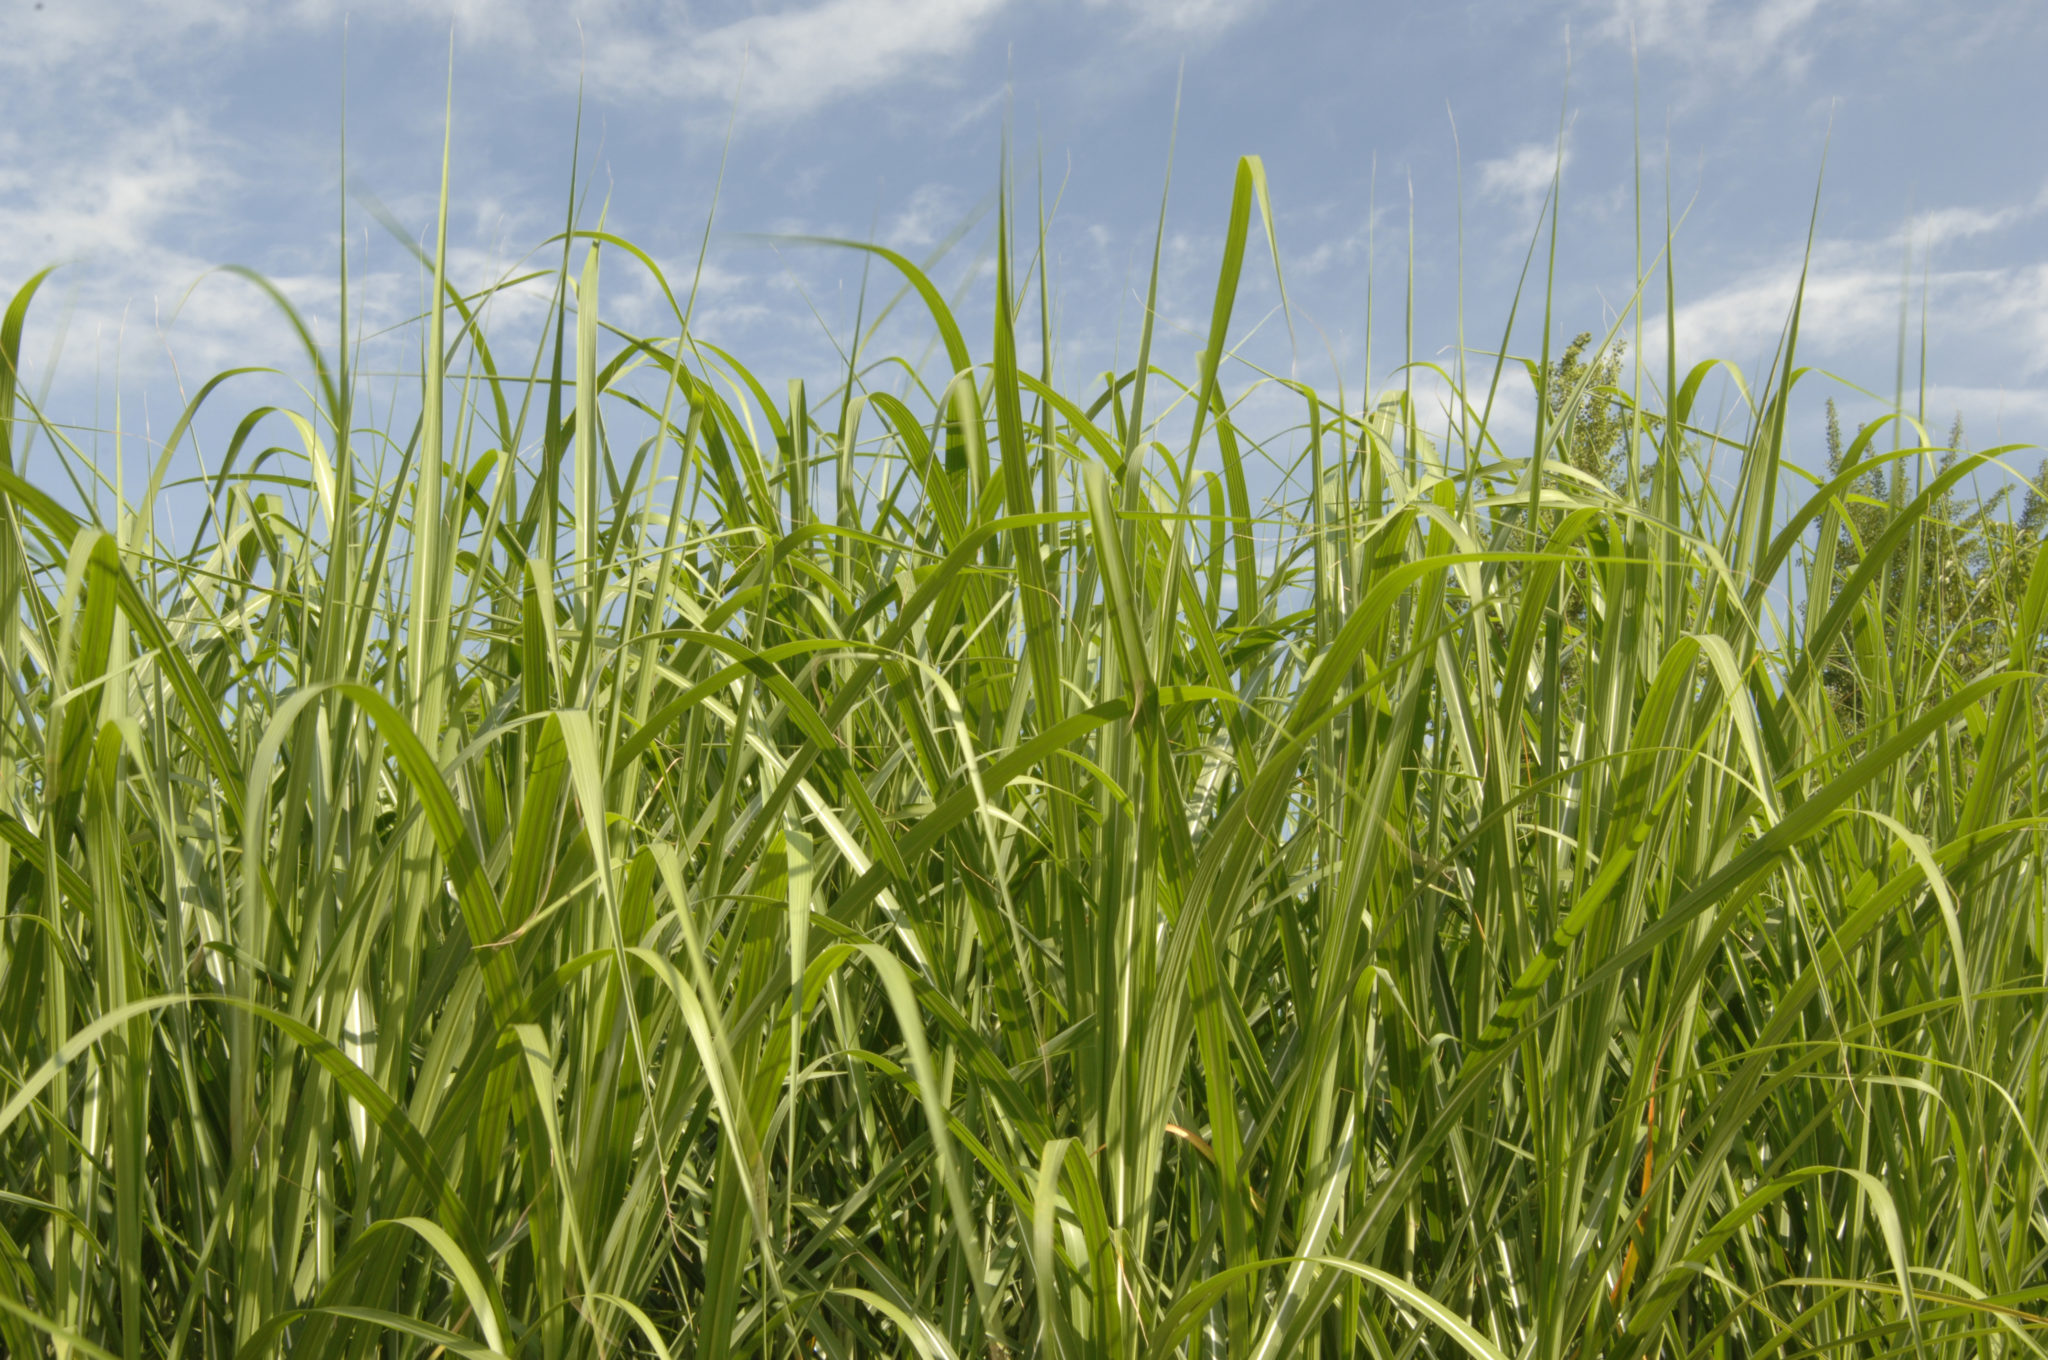
Biomass is a renewable resource consisting of plant matter such as trees, grasses, agricultural residues, and other biologic materials. Biomass can be converted to energy in the form of either electricity or transportation fuel. Bio-based energy has the potential to create jobs, increase economic development, and reduce US dependence on fossil fuels. Tennessee and the southern US are well-suited to producing biomass and enjoy a comparative advantage over many other regions.
To achieve this mission, BEAG brings together a multidisciplinary group of individuals to address the various questions surrounding the use of biomass for energy production. The diverse expertise of BEAG personnel enable it to address a wide range of bio-energy questions using an array of hierarchically and horizontally integrative models and analyses of the bio-based industry. BEAG capabilities include:
- Consumer acceptance and demand for alternative energy technologies
- Economic analysis and assessment of emerging energy technologies incorporating business structure and risk analysis
- Energy supply and demand, logistics, new crop technology assessment
- Bioenergy policy
- Impacts of new generation sources on rural and economic development
- System sustainability metrics

Projects
LEAF – Logistics for Enhanced-Attribute Feedstock
Survey – Farmer Views on Growing Pennycress as Energy Feedstocks
Analysis Models
BEAG utilizes a diverse set of peer-reviewed and documented model platforms, learn more about these models.
Presentations & Publications
BEAG personnel have presented their work across the country at various conferences and meetings as well as published research in the following topic areas:
- Economic Contribution/Impact Studies
- Consumer Acceptance and Increased Demand
- Logistics
- New Crop Technology Assessment
- Business Structure
- Rural & Economic Development
- Economic Analysis and Systems Approach
- Impacts of New Industry
- Coversion of Feedstock
- Environment
- Policy Analysis
Learn more by visiting our Publications page where you can search for presentations and publications in each specific topic area listed above.
Decision-Aid Tools
BEAG has developed decision-aid tools to assist producers and wood residue users, including:
Carinata Budget Worksheet
The Caranita Budget Worksheet is an interactive computerized decision aid designed to help researchers examine the costs of growing and harvesting Carinata as a cover crop between two row crops.
Camelina Budget Worksheet
The Camelina Budget Worksheet is an interactive computerized decision aid designed to help researchers examine the costs of growing and harvesting Carinata as a cover crop between two row crops.
Pennycress Budget Worksheet
The Pennycress Budget Worksheet is an interactive computerized decision aid designed to help researchers examine the costs of growing and harvesting Carinata as a cover crop between two row crops.
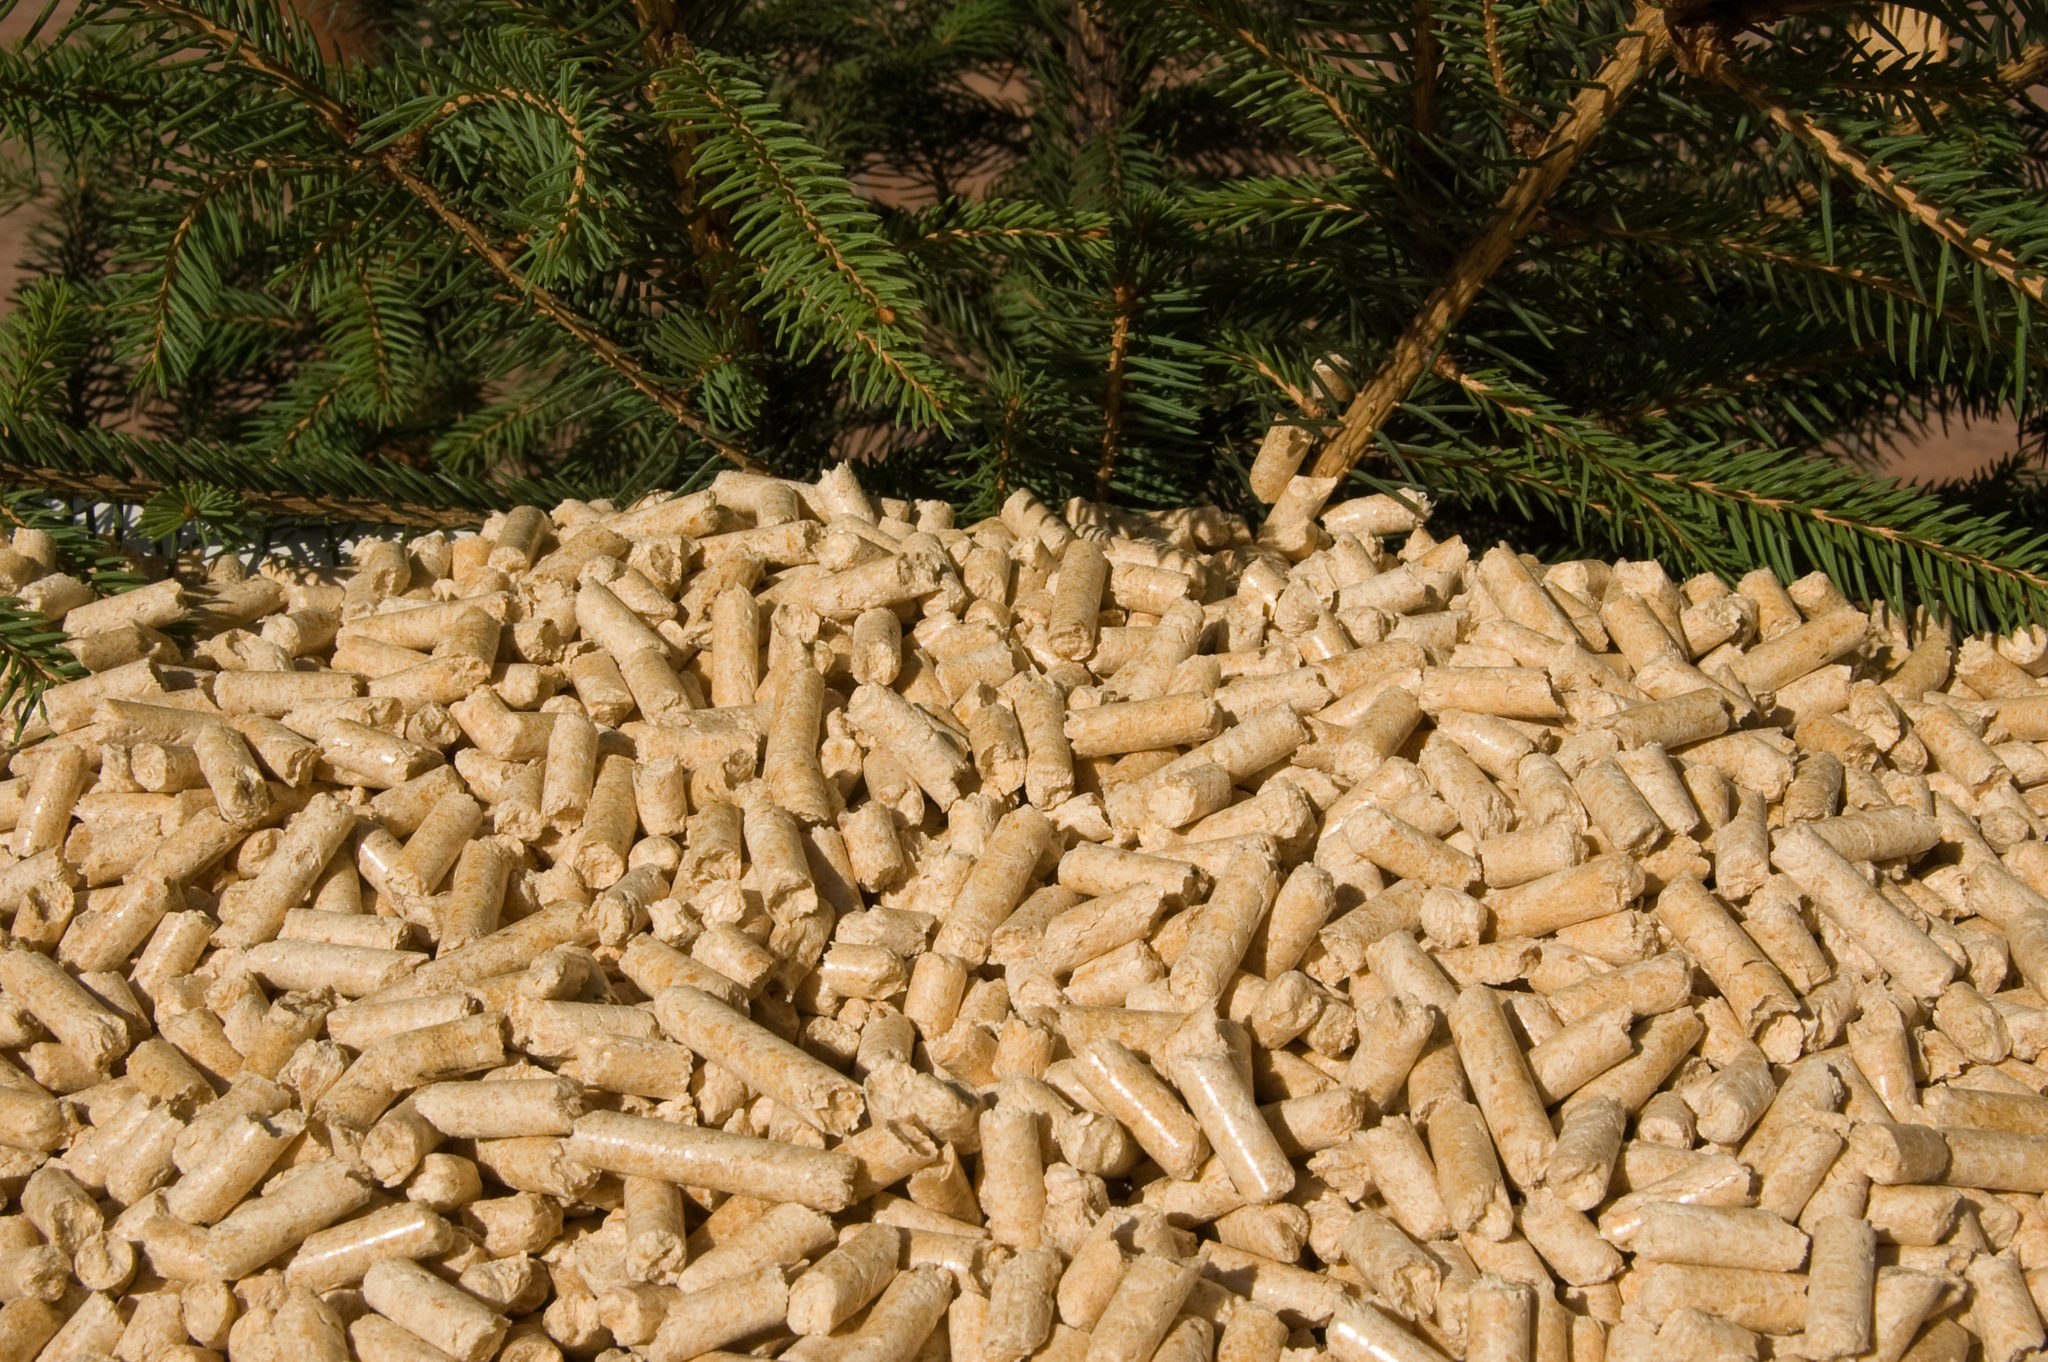
Wood Resource Transportation Analysis System
The Wood Resource Transportation Analysis System (WTRANS) is a spreadsheet based program which allows wood residue users to examine:
- where hardwood and softwood green mill residues may be located on a county-by-county basis in Tennessee,
- estimates of transportation and delivered product costs on a county-to-county basis in Tennessee,
- estimates of transportation and delivered product costs to your county from each county in Tennessee,
- potential residue needs for energy use, and
- estimated fuel cost comparisons using residues for greenhouse heating
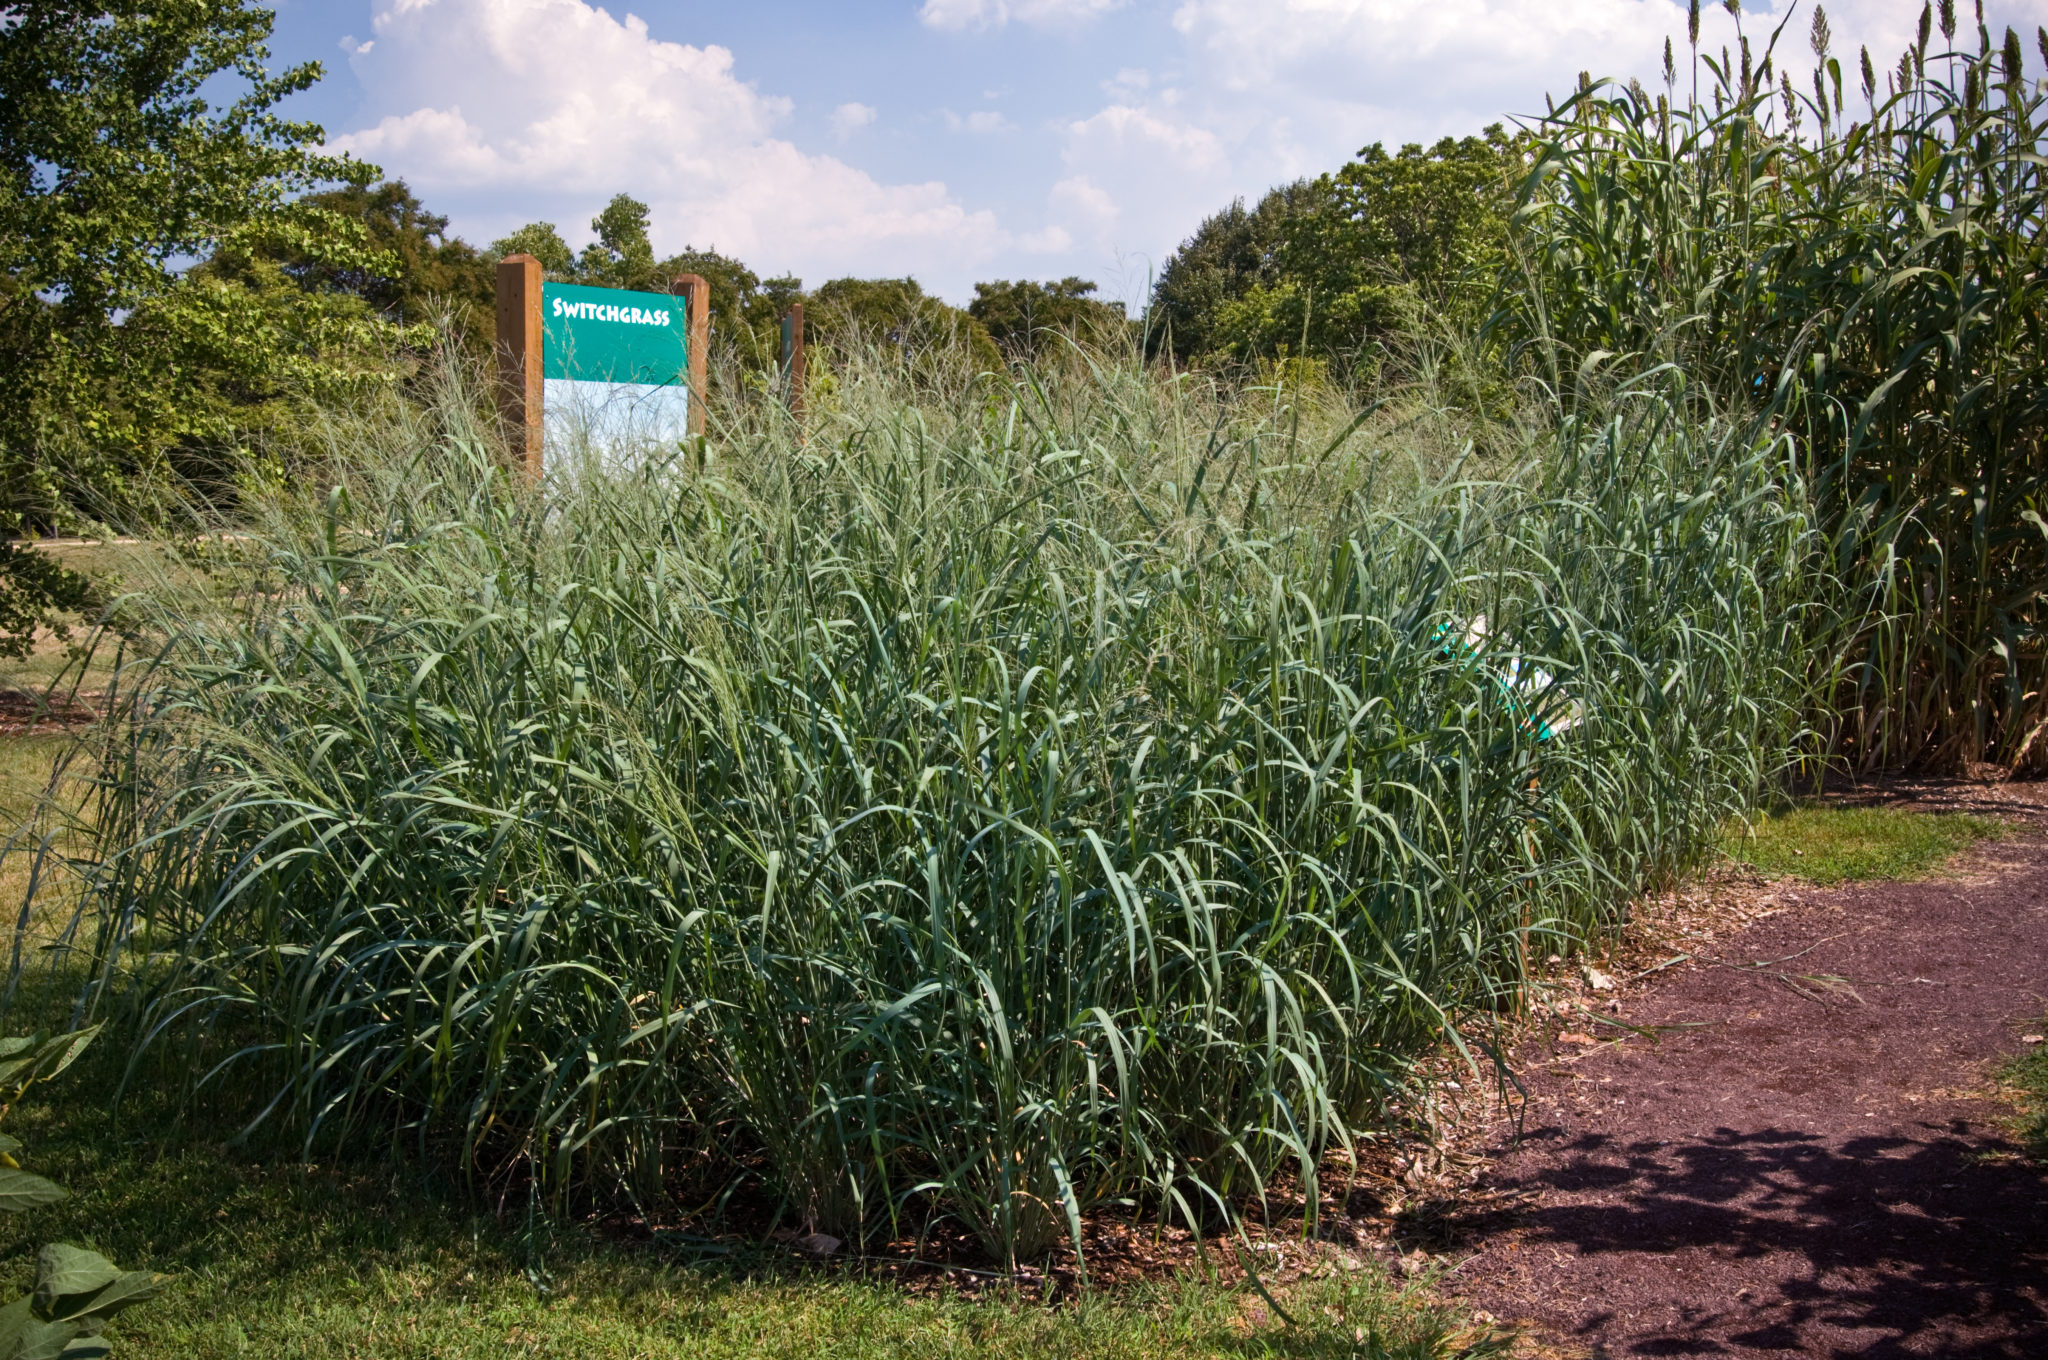
Switchgrass Production Decision Tool
The Switchgrass Production Decision Tool is an Excel-based decision tool for potential switchgrass producers that provides the user with detailed information on costs incurred in each stage of a switchgrass operation in each year of its duration (assumed to be 10 years in this tool).
Personnel
BEAG Personnel include:
- Chris Boyer
- Chris Clark
- Burton English
- Chad Hellwinckel
- Kim Jensen
- James Larson
- Jamey Menard
- Carlos Trejo-Pech
- Edward Yu